A new report from INRIX’s annual Global Traffic Scorecard, once again highlights the inefficiency of congestion and cost across European cities. London, Paris and Brussels lead the way and now more than ever is there a need for businesses to find alternative mobility solutions.
The study reveals average speeds in the world’s most significant urban areas and highlights the hundreds of hours lost as drivers sit at standstill. Covid has had an impact on these results compared with 2019 data, but the trend shows that this issue is not going away and new thinking and strategies are required.
London leads the way…with traffic congestion!
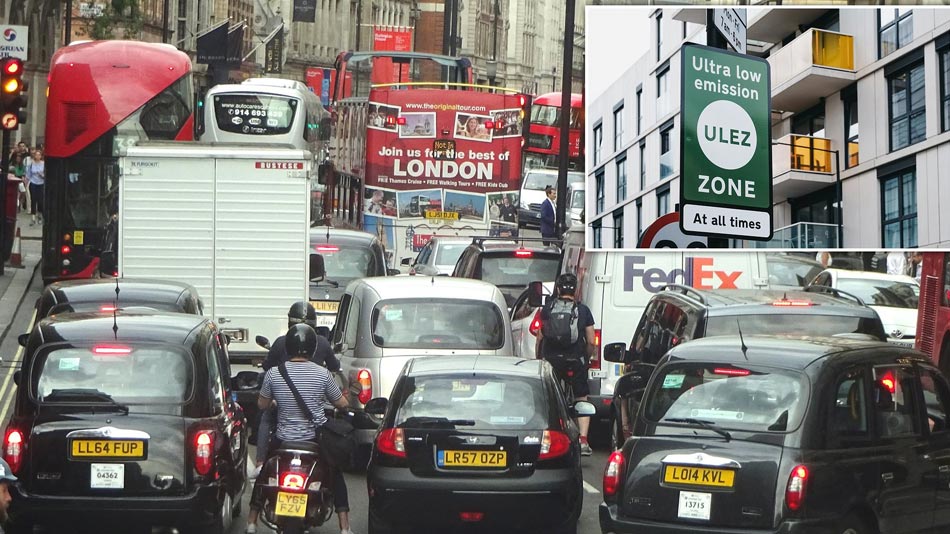
London was most heavily impacted by traffic congestion, with drivers losing 148 hours over the year. This is despite being one of the world’s first capitals to implement a Congestion Charging zone. Paris was 2nd (140 hours lost), Brussels came in 3rd (134 hours lost), Moscow, placed 4th (108 hours) and New York placed 5th(102 hours).
INRIX also tracked the average last mile speed as 17.6km/h (11mph) in London and Paris, and 16km/h (10mph) in Brussels.
These speeds are actually faster and congestion levels significantly lower than 2019, due to lower traffic levels because of lockdowns and people working from home. Drivers in Paris, for example, saved 25 hours compared to pre-COVID measures, and average speeds in London, Paris, Rome and New York all enjoyed improvements of between 10% and 27%.
The cost of traffic congestion
INRIX calculated that congestion cost the average driver in New York $1,595 in lost time and productivity, with similar financial impacts in London (£1,211) and Munich (€740).
Data from smartphones, cars, trucks and city sensors was captured and analysed to create the Global Traffic Scorecard, which ranks congestion and mobility trends across more than 1000 cities in 50 countries.
“Access to reliable data is the first step in tackling congestion,” said a spokesman for INRIX. “Applying big data to create intelligent transportation systems is key to solving urban mobility problems. INRIX data and analytics on mobility, traffic and traffic signals, parking and population movement help city planners and engineers make data-based decisions to prioritise spending to maximise benefits and reduce costs now and into the future.”
The world’s 20 most congested cities.
| City | Hours lost in congestion (2021 rank) | Change from pre-COVID | Last mile speed (km/h) |
|---|---|---|---|
| London | 148 | -1% | 22.4 |
| Paris | 140 | -15% | 20.8 |
| Brussels | 134 | -4% | 20.8 |
| Moscow | 108 | -15% | 24 |
| New York City NY | 102 | -27% | 19.2 |
| Chicago IL | 104 | -28% | 24 |
| Rome | 107 | -35% | 24 |
| Bogota | 94 | -51% | 17.6 |
| Palermo | 109 | -20% | 17.6 |
| Istanbul | 88 | -42% | 22.4 |
| Bucharest | 98 | - | 24 |
| Lyon | 102 | -2% | 20.8 |
| Philadelphia PA | 90 | -37% | 19.2 |
| Rostov-on-Don | 97 | 16% | 22.4 |
| Budapest | 92 | - | 27.2 |
| Dublin | 89 | -42% | 22.4 |
| Turin | 93 | -24% | 20.8 |
| Boston MA | 78 | -47% | 24 |
| Bursa | 82 | 75% | 30.4 |
| Saint Petersburg | 75 | -50% | 24 |
What does this mean for you?
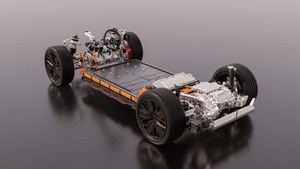
We are having many conversations on fleet electrification for the moment. For companies established in congested urban environment we include other mobility solutions as well, including discussions on the legal and tax framework of these “mobility budgets”. There is a desire from many to adapt their vehicle policy which in turn can help in a cities overall congestion health. Smarter mobility could be the answer.
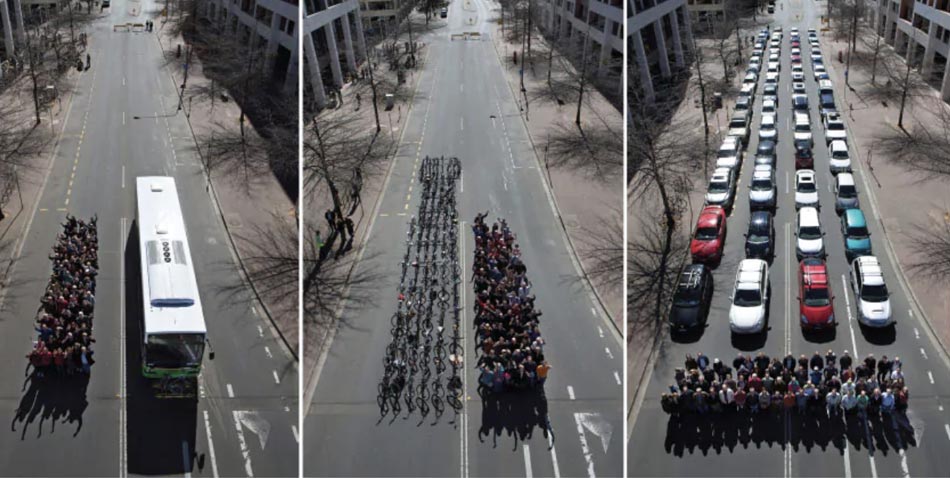
Alternative transportation – can the car be a second choice occasionally?
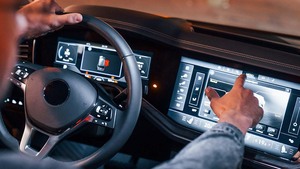
There are compelling options to the “one car, one driver” model. For smart mobility, alternative options would need to be connected to the cloud:
- Bicycle commuting: ideal for commutes of a few miles or more miles for e-bikes/speedelecs
- Carsharing: rent cars by the minute or by the hour
- Ridesharing (carpooling): make use of the empty seats already in the system
- On-demand ride services: use personal vehicles to offer transportation services
- Buses and trains: reimagining existing transportation by integrating them into end-to-end trip plans, including how to travel the last mile home
“The challenge for offering alternative mobility solutions is the mobility profile as a big element in the mobility equation. The mobility profile is per definition personal, so mapping these profiles, the appetite and knowledge of solutions is of the utmost importance. Matching profiles and needs to existing solutions is key. Legal and tax framework are the basis for a solid mobility policy.”
Do you want to share ideas and thoughts? Do not hesitate to contact us.